Jera Value
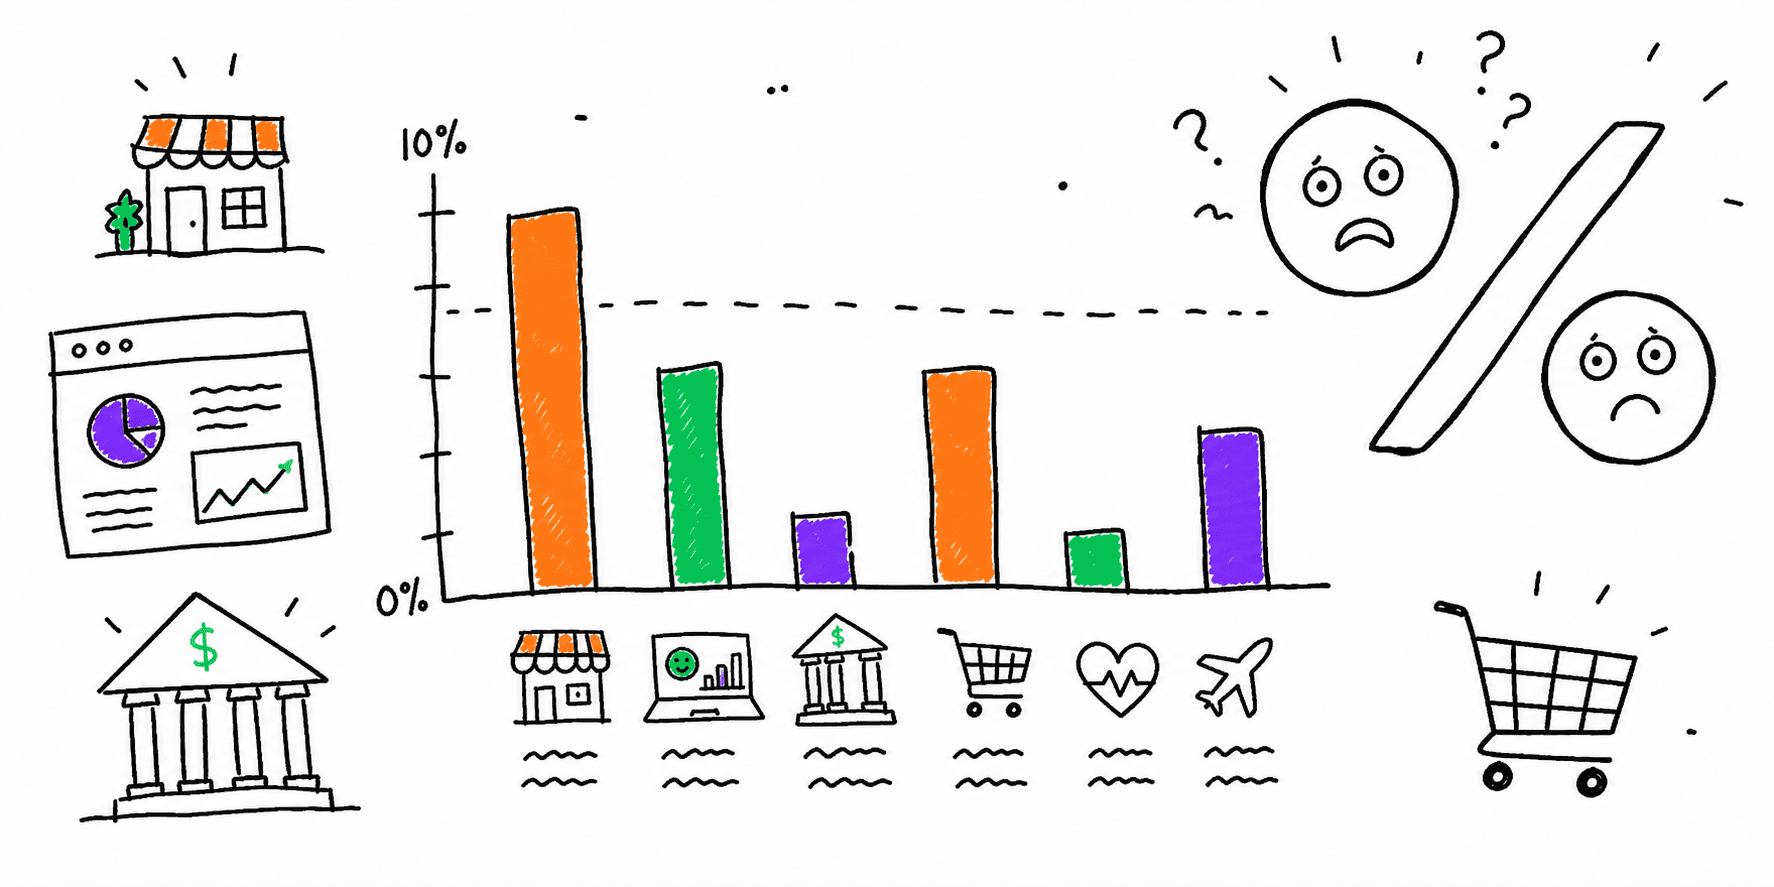

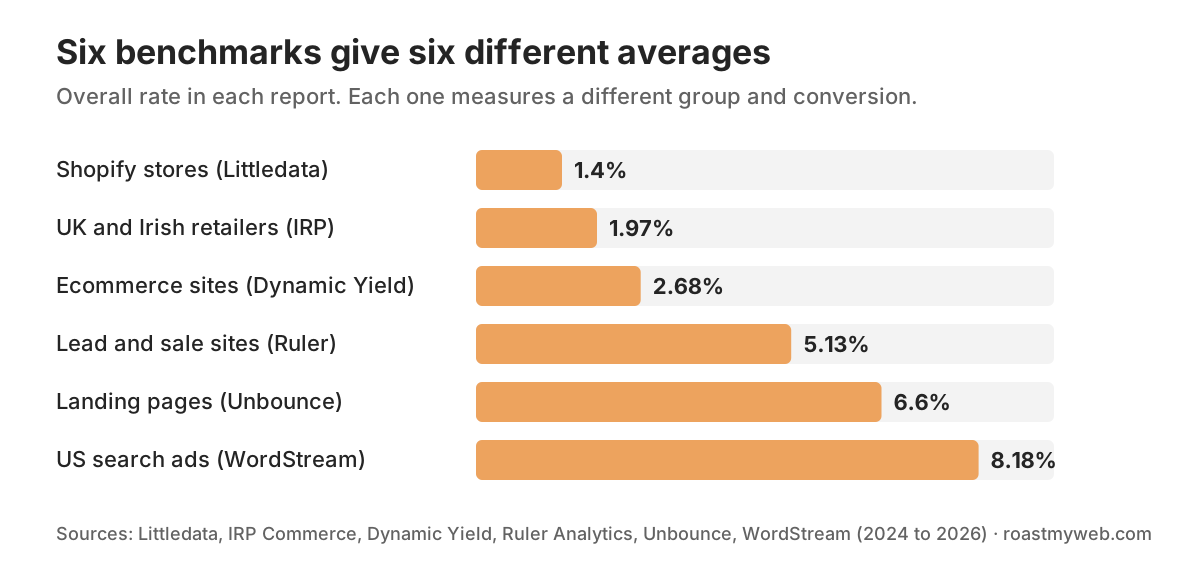
Ask six benchmark reports for the average website conversion rate and you get six different answers. Littledata puts the median Shopify store at 1.4%. Unbounce puts the median landing page at 6.6%. WordStream puts the median US search ad campaign at 8.18%. None of these numbers is wrong. Each report measures a different group of websites and counts a different kind of conversion.
This page puts the 2026 numbers side by side: by industry, by traffic source, by device and by business model. Every number names its source, its sample and its date, and links to the report that measured it. At the end, you will know which benchmark fits your own site and which ones to ignore.
Average website conversion rate by industry: key numbers
- The average website conversion rate across 13 industries was 5.13% in the Ruler Analytics 2026 benchmarks, where a conversion is a qualified lead or a sale.
- The median landing page converted 6.6% of visitors across more than 41,000 Unbounce landing pages measured from July 2023 to July 2024.
- The median Shopify store converted 1.4% of sessions into orders across 433 stores that Littledata tracked from July to October 2026.
- Travel websites had the lowest average conversion rate of 13 industries in the Ruler Analytics 2026 benchmarks, at 1.9%.
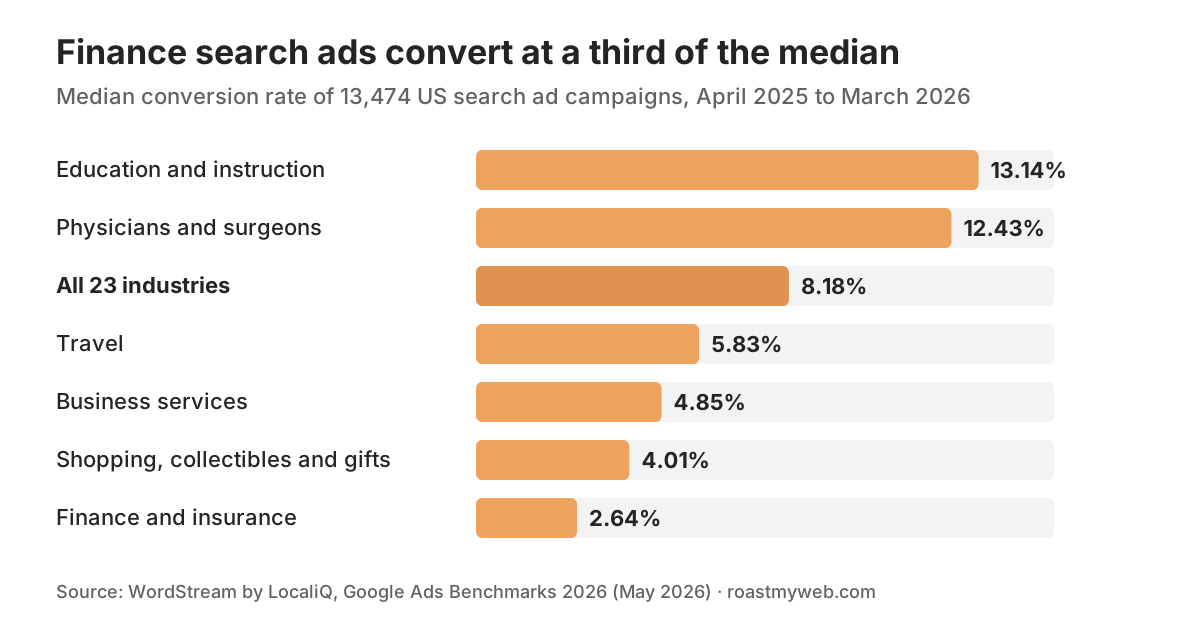
- Finance and insurance search ad campaigns had a median conversion rate of 2.64%, the lowest of 23 industries in the WordStream 2026 benchmark.
- Visits from AI assistants converted at 5.8%, the highest rate of any traffic source in the Ruler Analytics 2026 benchmarks.
- Mobile visitors converted better than desktop visitors in two 2026 ecommerce benchmarks, Littledata and Dynamic Yield.
What is a good website conversion rate?
A good website conversion rate is a rate above the median of sites that count the same conversion as you. There is no industry standard conversion rate for all websites. For an online store, a rate above 2.7% put a Shopify store in the top 20% of 433 stores in the Littledata benchmark for July to October 2026. For a lead generation website, the Ruler Analytics 2026 average was 5.13% across 13 industries. For a campaign landing page, the Unbounce 2024 median was 6.6%.
Then compare with your own industry, because the spread is large. Travel websites averaged 1.9% and legal websites averaged 7.9% in the same Ruler Analytics data. To see what a higher rate is worth in revenue for your site, use the website ROI calculator.
Why the average website conversion rate depends on the source
A conversion rate is a share: conversions divided by visits. Each benchmark defines both parts in a different way, so each one gives a different "average". Littledata divides orders by sessions. Dynamic Yield divides orders by users, so one person with three visits counts once. Ruler Analytics counts a qualified lead or a sale. Unbounce counts any goal on a single campaign landing page, such as a form or a click, and these pages usually get targeted traffic.
The sample also changes the result. Every report on this page measures the customers of one company: Shopify stores that use Littledata, sites that use Dynamic Yield, landing pages built with Unbounce, or advertisers that work with WordStream. These are large samples, but they are not "all websites". Some reports also give a median and others an average. A median shows the typical site. An average moves up when a few sites convert very well.
So there is no single normal conversion rate. A 3% rate is weak for a landing page that gets email traffic, but it is strong for a luxury store. Before you compare, find the report that counts the same conversion, from the same kind of visit, as your site.
Website conversion rate by industry table
The table shows each industry in three benchmarks. Read across a row, not down a column, because each column measures a different thing. The Ruler column counts qualified leads and sales on whole websites. The Unbounce column counts goals on single landing pages. The WordStream column counts conversions from US search ad campaigns.
| Industry | Ruler Analytics 2026 (website average) | Unbounce 2024 (landing page median) | WordStream 2026 (search ads median) |
|---|---|---|---|
| All industries | 5.13% | 6.6% | 8.18% |
| Finance and insurance | 6.3% | 8.3% | 2.64% |
| Healthcare | 2.3% (health and social care) | 5.1% (health and wellness) | 12.43% (physicians and surgeons) |
| Education | 6.3% | 8.4% | 13.14% |
| Professional services | 6.1% | 6.1% | 4.85% (business services) |
| Legal | 7.9% | 6.3% | Not used here |
| Software and SaaS | 7.6% | 3.8% | Not in the report |
| Travel and hospitality | 1.9% | 4.8% | 5.83% |
| Retail and ecommerce | 2.4% | 4.2% | 4.01% (shopping and gifts) |
The rankings do not agree. Finance is near the top for landing pages but at the bottom for search ads. Healthcare is near the bottom for whole websites but near the top for search ads. The difference comes from the conversion each report counts. A search ad for a doctor often leads to one call or booking, but a health website also serves many readers who only want information.
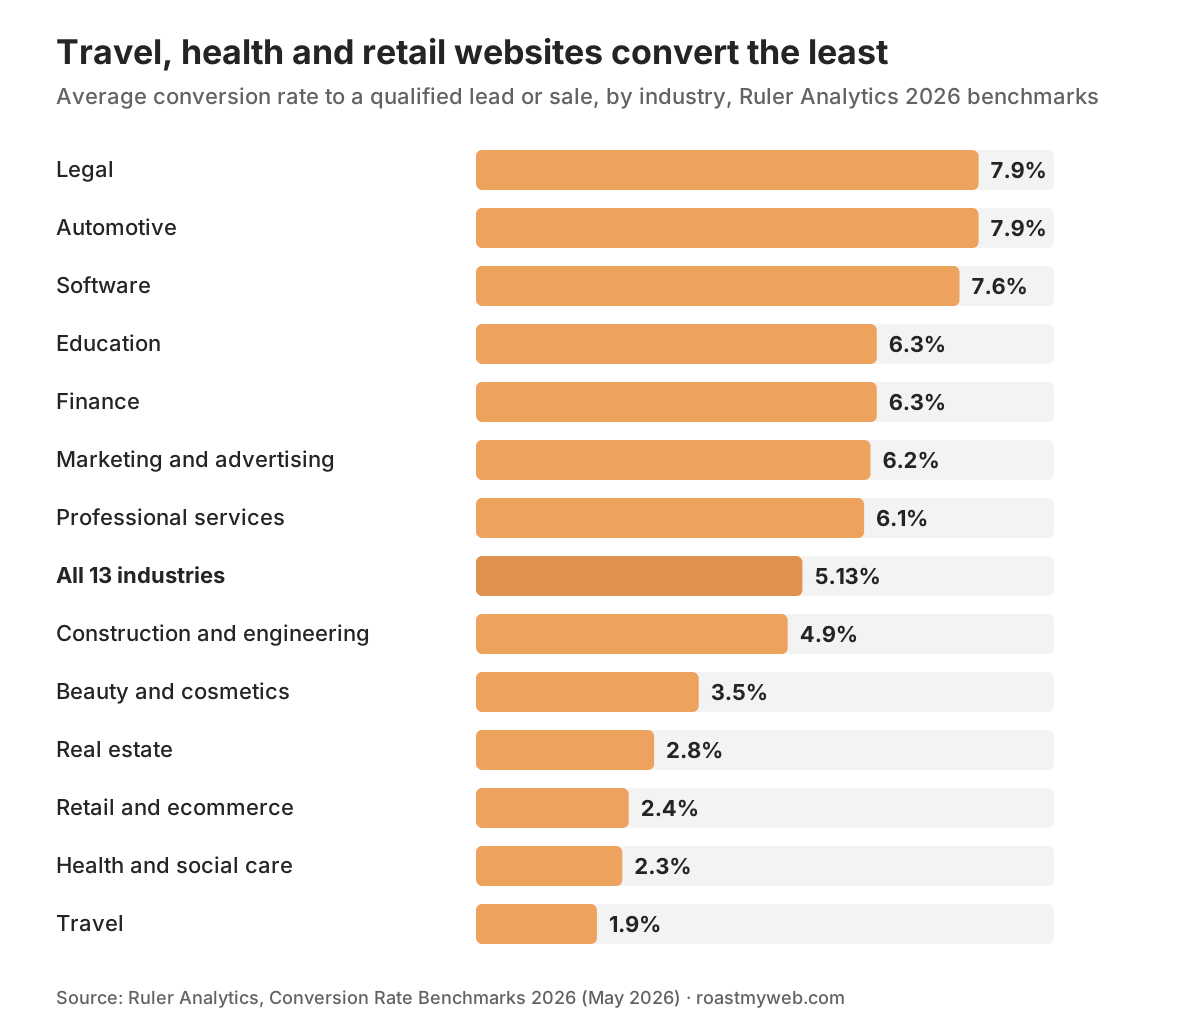
The Ruler Analytics 2026 benchmarks cover 13 industries, more than 110 million sessions and more than 5 million conversions. Legal and automotive websites had the highest average at 7.9%, and software followed at 7.6%. Travel had the lowest average at 1.9%, then health and social care at 2.3% and retail and ecommerce at 2.4%. Real estate (2.8%), beauty and cosmetics (3.5%) and construction and engineering (4.9%) were also below the 5.13% average. Ruler does not state the period when it collected the data, so treat these numbers as a 2026 snapshot.
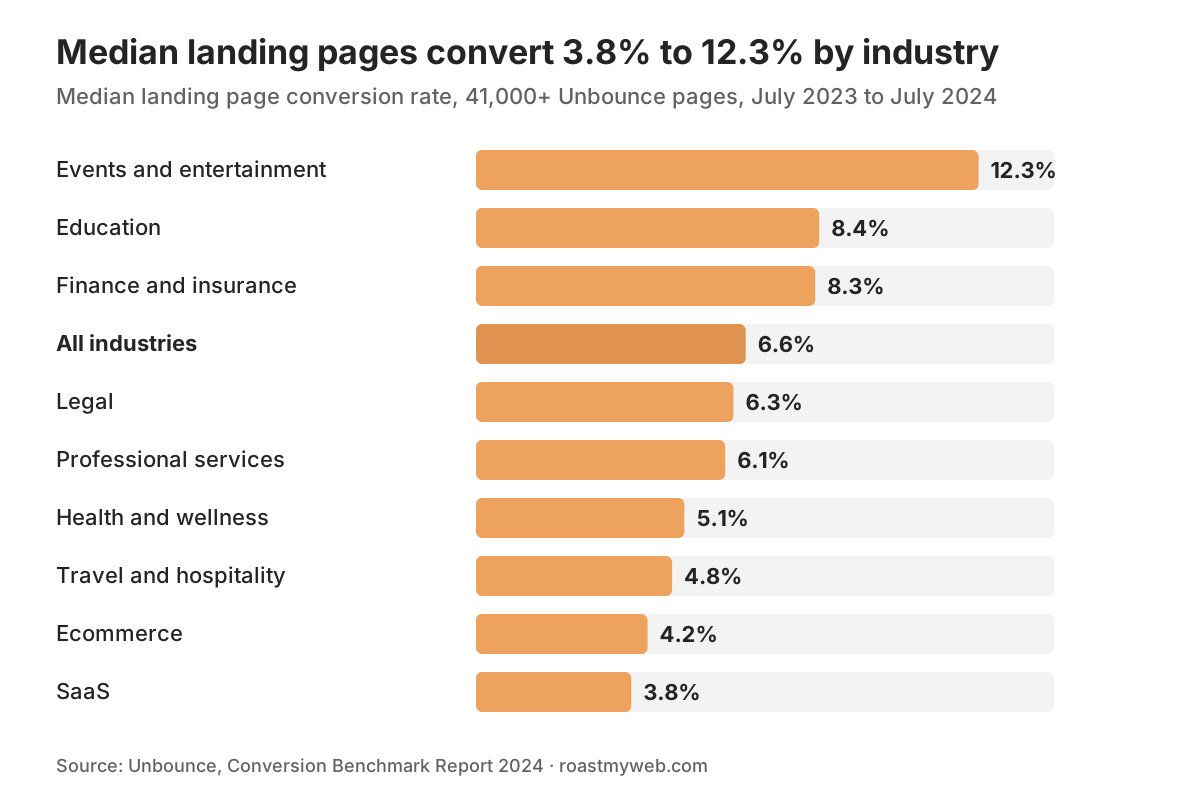
The Unbounce Conversion Benchmark Report 2024 measured more than 41,000 Unbounce landing pages, 464 million visitors and 57 million conversions from July 2023 to July 2024. It is the latest edition of the report. Events and entertainment pages had the highest median at 12.3%, but sweepstakes pages raise that number. Education (8.4%) and finance and insurance (8.3%) followed. SaaS had the lowest median of the industries in the chart at 3.8%.
Ecommerce conversion rates
The median Shopify store converted 1.4% of sessions into orders across 433 stores in the Littledata Shopify benchmark for July to October 2026. A store needed more than 2.7% to be in the top 20% of that sample. Beauty and skincare stores had the highest median at 2.9%, and home and furniture stores had the lowest at 1.0%. So a furniture store at 1.5% does better than most of its peers, even though it is close to the overall median.
Ecommerce sites that use Dynamic Yield had an average conversion rate of 2.68% from October 2025 to September 2026, according to the Dynamic Yield conversion rate benchmarks. Dynamic Yield counts users, not sessions, so do not compare its rates directly with session-based rates. Beauty and personal care sites had the highest average at 5.38%, and luxury and jewelry sites had the lowest at 0.69%. Sites in EMEA converted at 2.84%, in the Americas at 2.59% and in APAC at 1.46%.
UK and Irish online retailers on the IRP Commerce platform converted 1.97% of sessions in September 2026, up from 1.68% in September 2025, according to IRP Commerce market data. The trend is not the same everywhere. Conversion rates on more than 6,500 websites in 9 industries fell 5.1% from Q4 2024 to Q4 2025 in the Contentsquare 2026 Digital Experience Benchmark. That sample covers all industries, not only stores.
Mobile now converts at least as well as desktop in two large ecommerce samples. The median Shopify store converted 1.6% of mobile sessions and 1.5% of desktop sessions in the Littledata benchmark. Mobile visitors on Dynamic Yield sites converted at 2.86% and desktop visitors at 2.23%. The earlier version of this page said that desktop converts better, and the 2026 data does not support that. For a store with mostly mobile traffic, the phone checkout is now the main checkout, so test it first. Our guide on how to improve website performance shows how to make that checkout faster.
Shopping cart abandonment is the share of carts that do not become orders. The average documented cart abandonment rate is 70.22% across 50 studies that Baymard Institute collected from 2006 to 2025. Shoppers on Dynamic Yield sites left 77.38% of carts without a purchase from October 2025 to September 2026, as shown in its cart abandonment benchmark. The median Shopify store in the Littledata cart abandonment benchmark lost 78% of sessions that added a product to the cart. For checkout steps after the cart, see our checkout completion rate benchmarks.
Financial services conversion rates
Finance websites had an average conversion rate of 6.3% to qualified leads or sales in the Ruler Analytics 2026 benchmarks. The median finance and insurance landing page converted 8.3% of visitors in the Unbounce 2024 report. Search ads tell a different story: finance and insurance campaigns had a median conversion rate of 2.64% in the WordStream by LocaliQ 2026 benchmark, the lowest of 23 industries.
The product matters more than the industry label. Insurance landing pages converted 18.2% of visitors in the Unbounce finance and insurance data, while investing pages converted 3.9%. A quote form for car insurance asks for a small first step. An investment account asks for trust, documents and money. Compare your site with the same product, not with "finance".
SaaS conversion rates
Software company websites converted an average of 7.6% of visits into qualified leads or sales in the Ruler Analytics 2026 benchmarks. Paid search visits to those sites converted at 8.2%. On single landing pages the rate is lower: the median SaaS landing page converted 3.8% of visitors in the Unbounce SaaS data, against 6.6% for all industries.
SaaS conversion has two steps: a visitor signs up, then a free user pays. In a January 2026 survey of 200 B2B software products by ChartMogul, Growth Unhinged and ProductLed, products with a free trial turned 4.5% of visitors into signups. Freemium products turned 9% of visitors into signups. The median product converted 8% of free signups or leads into paying customers within six months. Free trials that required a credit card converted 30% of trial users to paid in the same period.
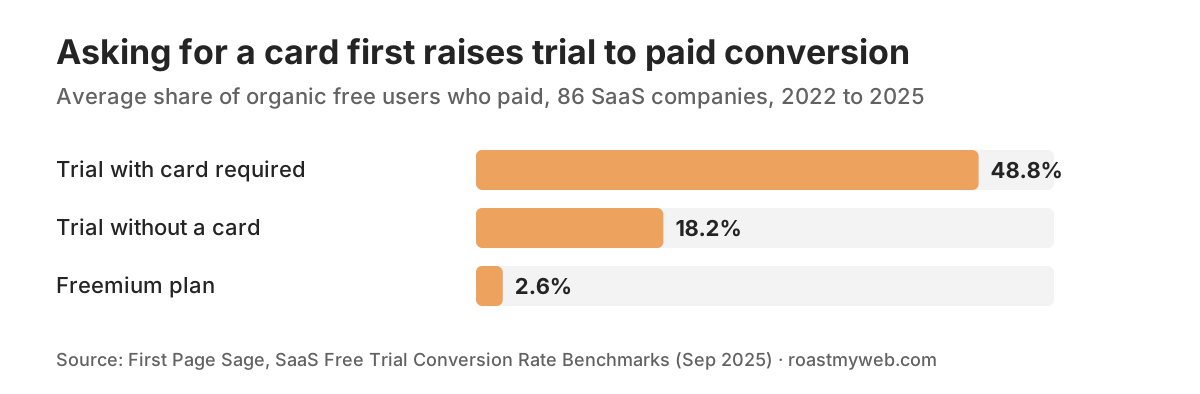
A second dataset shows the same pattern. SaaS trials that required payment details converted 48.8% of organic trial users to paying customers across 86 companies from 2022 to 2025, in the First Page Sage free trial benchmarks. Trials without a card converted 18.2%, and freemium plans converted 2.6%. The same report found that SaaS websites converted 8.5% of organic visitors to a free trial without a card. A card requirement gives fewer signups but more paying users, so measure both steps before you change it. Our SaaS conversion rate benchmarks cover the trial funnel in more detail.
Healthcare conversion rates
Health and social care websites had an average conversion rate of 2.3% in the Ruler Analytics 2026 benchmarks, one of the three lowest of 13 industries. The median health and wellness landing page converted 5.1% of visitors in the Unbounce health and wellness data, and dental services pages converted 4.3%. Search ads for physicians and surgeons had a median conversion rate of 12.43% in the WordStream 2026 benchmark.
The gap shows two kinds of visitors. A person who searches for a surgeon and clicks an ad often wants to book now. A person who reads a health website often wants information first. An earlier version of this page gave a healthcare range of 2.8% to 4.2%. We could not trace that range to any study, so we removed it. Use the three numbers above, each with its own definition.
Education conversion rates
Education websites had an average conversion rate of 6.3% to qualified leads or sales in the Ruler Analytics 2026 benchmarks. The median education landing page converted 8.4% of visitors in the Unbounce education data, and higher education pages converted 6.3%. Education and instruction search ads had a median conversion rate of 13.14% in the WordStream 2026 benchmark, well above the 8.18% median for all industries. Most education conversions are small first steps, such as a brochure request or a course enquiry, so the next step in the funnel needs its own measurement.
B2B and professional services conversion rates
Professional services websites converted an average of 6.1% of visits into qualified leads or sales in the Ruler Analytics 2026 benchmarks. Organic search was the strongest traffic source for these sites, at 8.1%. Legal websites averaged 7.9%, the highest industry rate together with automotive, and marketing and advertising websites averaged 6.2%.
The median commercial and professional services landing page converted 6.1% of visitors in the Unbounce professional services data. That category includes home renovation services, so it is not a pure B2B number, but it fits small service businesses that take leads by form or phone. Business services search ads had a median conversion rate of 4.85% in the WordStream 2026 benchmark. For B2B sites, a lead is not a customer, so track lead quality next to the conversion rate.
Travel and hospitality conversion rates
Travel websites had the lowest average conversion rate of 13 industries in the Ruler Analytics 2026 benchmarks, at 1.9%. The median travel and hospitality landing page converted 4.8% of visitors in the Unbounce travel and hospitality data, and accommodation pages converted 3.7%. Travel search ads had a median conversion rate of 5.83% in the WordStream 2026 benchmark. Travellers compare many options over many visits before they book, so a low rate per visit is normal for this industry.
Conversion rates by traffic source
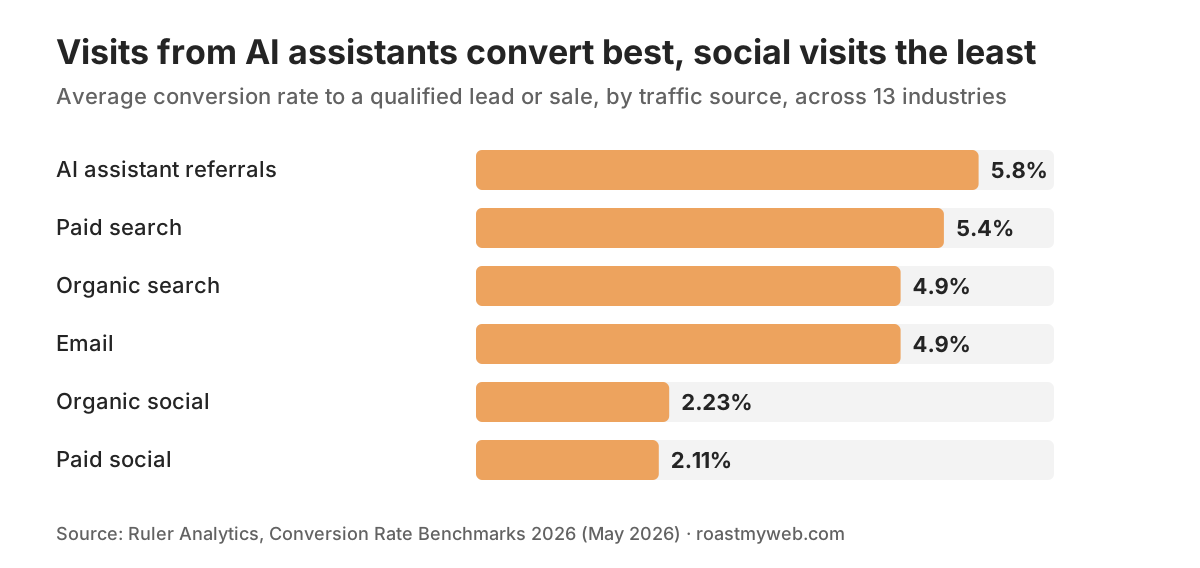
Visits referred by AI assistants converted at an average of 5.8% across 13 industries in the Ruler Analytics 2026 benchmarks, the highest rate of any traffic source in that study. Paid search visits converted at 5.4%. Organic search and email visits both converted at 4.9%. Social visits converted the least: 2.23% for organic social and 2.11% for paid social.
Landing pages show a different order. Unbounce landing pages converted 19.3% of email visitors, 12% of paid social visitors and 10.9% of paid search visitors in the Unbounce 2024 report. The order changes because a campaign landing page gets visitors who already clicked a specific offer. A whole website gets many visitors who only browse. So compare a campaign page with landing page data, and compare a full site with website data. For the parts of a campaign page that change its rate, see our landing page best practices.
Website traffic benchmarks by industry
Website traffic fell in 2025. Visits to more than 6,500 websites in 9 industries fell 3.8% year on year from Q4 2024 to Q4 2025, according to the Contentsquare 2026 Digital Experience Benchmark. Contentsquare links the drop to search results that answer questions directly, so fewer people click through to websites. Engagement fell 10% in the same data, with less time on site, fewer pages and less scrolling per visit.
AI assistants referred 0.2% of visits in the Contentsquare data. That share is small, but these visits convert well: AI referrals had the highest conversion rate of any traffic source in the Ruler Analytics 2026 benchmarks, at 5.8%. So less traffic does not have to mean fewer customers. When visits fall, a higher conversion rate on the same pages keeps the result.
Contentsquare shows traffic by industry only in its interactive report. None of the reports on this page publishes an average number of visits per month for each industry with a stated method, so this page does not give one. For your own site, compare traffic with the same month last year, by source, before you compare with any industry figure.
Google Ads conversion rates
The median conversion rate of US search ad campaigns was 8.18% in the WordStream by LocaliQ 2026 benchmark, for the year from April 2025 to March 2026. The sample was 13,474 campaigns on Google Ads and Microsoft Ads. One year earlier, the WordStream 2025 benchmark gave a median of 7.52% for April 2024 to March 2025.
Online stores see much lower rates from Google Ads. Ecommerce brands that use Triple Whale had a median Google Ads conversion rate of 3.11% from August 2025 to July 2026, down from 3.34% one year earlier, in the Triple Whale Google Ads benchmarks. That number includes all campaign types, not only search, and it counts purchases. So do not compare it directly with the WordStream median.
How to use these benchmarks for your own site
If your conversion rate is lower than the industry average, first check that you compare the same thing. A benchmark is useful only when it measures the same conversion and the same visits as your site. Use these steps before you compare:
- Choose the report that counts your conversion. For orders, use Littledata, Dynamic Yield or IRP Commerce. For leads and sales from a whole site, use Ruler Analytics. For a single campaign page, use Unbounce. For search ads, use WordStream.
- Check the visit count. Divide by sessions when the report uses sessions, and by users when it uses users.
- Compare by traffic source and by device first. A site with mostly social traffic will convert below a site with mostly search traffic in the same industry.
- Compare with your own trend every month. Your rate last quarter is a better benchmark than any industry average.
- When a key page is below its benchmark, check the page itself: the offer, the main call to action, the form, the proof and the mobile layout.
For step 5, a conversion rate optimisation audit gives you a list of problems on one page and the fixes, in order. A Roast My Web audit checks one public page, including its main call to action, forms and contact path, and gives a report that you can share with a client or a team. For changes to campaign pages, see our guide to landing page optimisation. For a full process across a whole site, read our guide to website conversion optimization.
How we checked these numbers
We checked 109 candidate figures against the original reports in October 2026. We kept 71 figures from 11 publishers and rejected 32. Six figures stay unused because we could not open or confirm the source. We used only the organisation that collected the data, and we named the sample, the period and the definition of a conversion for each number. We did not average numbers from different reports, because each report measures a different thing.
Some limits apply. Each sample is made of one company's customers. The Unbounce 2024 report is the latest edition, but its data ends in July 2024. Ruler Analytics does not state its collection period. Dynamic Yield does not state how many sites its sample includes.
This page changed on October 21, 2026. We rewrote it with 2026 data. We removed the planning ranges, the industry comparison table and the company examples from the earlier version, because we could not trace them to a primary source.
How to cite this page
To cite this page, use: Roast My Web (2026), "Average Website Conversion Rate by Industry: 2026 Benchmarks", https://www.roastmyweb.com/blog/average-website-conversion-rate-by-industry. When you quote a number, please also name the report that measured it, as each section above does. You can use the charts on this page if you link back to it.