Dominate Website Performance
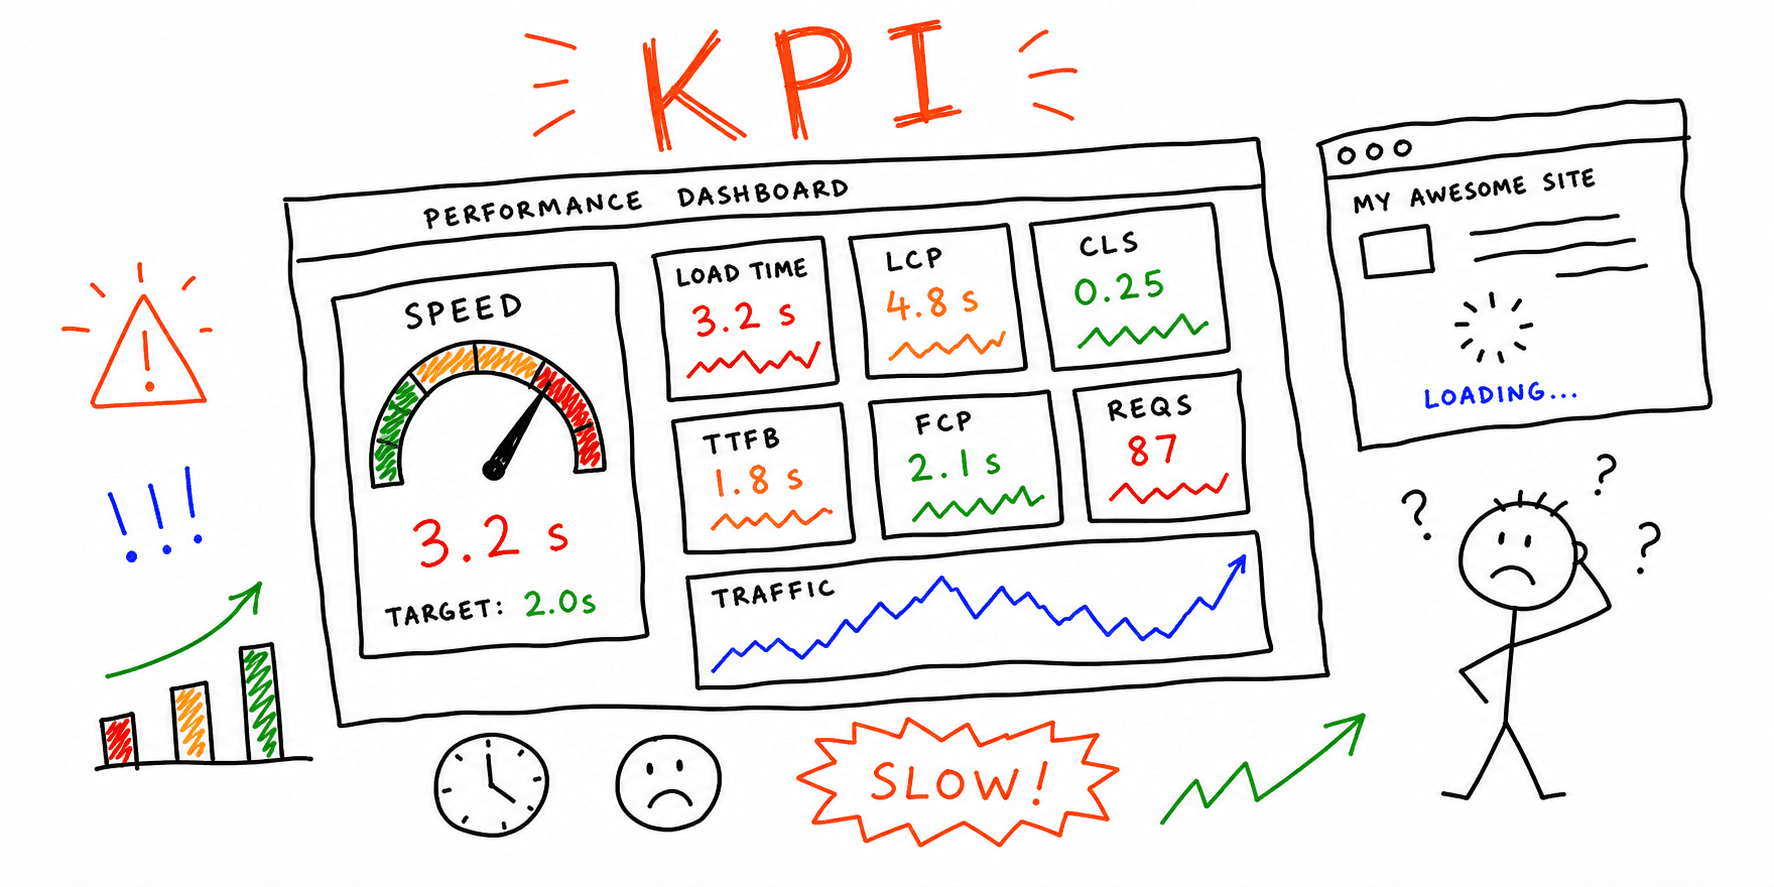
Want a website that ranks higher, converts better, and keeps users engaged? You need to understand key website performance indicators. This listicle covers eight essential metrics, including page load time, Time to First Byte (TTFB), First Contentful Paint (FCP), Largest Contentful Paint (LCP), Cumulative Layout Shift (CLS), bounce rate, conversion rate, and First Input Delay (FID). Mastering these website performance indicators is crucial for attracting and retaining users, boosting conversions, and ultimately, achieving online success. We'll explain why each metric matters and offer actionable advice for improvement. Let's optimize your website for peak performance.
1. Page Load Time
Page Load Time is a crucial website performance indicator that measures the total time it takes for a web page to fully load and display all of its content in a user's browser. This encompasses the entire duration from the moment a user clicks a link or enters a URL to the point when the browser finishes rendering every element on the page, including text, images, scripts, and other resources. It's a critical metric because users have little patience for slow websites. In today's fast-paced digital world, a sluggish website can lead to high bounce rates, lost conversions, and ultimately, damage to your brand reputation. Understanding and optimizing page load time is essential for anyone serious about online success.

Page load time is typically measured in seconds or milliseconds and can be broken down into several components, including server response time, resource loading time, and rendering time. Various factors influence page load time, including server performance, page complexity (number of elements, size of resources), and the user's network conditions. For freelance web designers, digital marketing agencies, startup founders, solo entrepreneurs, and UX/UI specialists, understanding these components is crucial for diagnosing and addressing performance bottlenecks.
This metric deserves a top spot in any list of website performance indicators because it directly correlates with user experience and satisfaction. A fast-loading website contributes to a positive user experience, encouraging visitors to explore more pages, engage with content, and ultimately, convert into customers or clients. Conversely, a slow website frustrates users and drives them away.
Features and Benefits:
- Comprehensive Measurement: Measures the total time from request initiation to complete page render, providing a holistic view of site performance.
- Quantifiable Data: Expressed in seconds or milliseconds, allowing for precise tracking and benchmarking.
- Diagnostic Capabilities: Can be broken down into component times (server response, resource loading, rendering) to pinpoint performance bottlenecks.
- User-Centric Focus: Directly reflects the user experience and can significantly impact user satisfaction.
- Measurable Impact: Improvements in page load time often translate to higher conversion rates and improved SEO.
Pros and Cons:
Pros:
- Directly correlates with user experience and satisfaction.
- Easy to measure using various tools.
- Provides a comprehensive view of overall site performance.
- Improvement often leads to higher conversion rates.
Cons:
- Can vary widely based on user's device and connection speed.
- Doesn't always distinguish between critical and non-critical resources.
- May not accurately reflect perceived performance (how fast a user feels the page is loading).
- Optimization can require significant technical expertise.
Examples of Successful Implementation:
- Amazon: Found that every 100ms of latency cost them 1% in sales, highlighting the direct impact of page load time on revenue.
- Google: Reduced the page size of Google Maps by 30%, resulting in a 30% increase in map loads, demonstrating the benefits of optimization.
- Pinterest: Reduced perceived wait times by 40% and increased search engine traffic and sign-ups by 15% by focusing on perceived performance optimization.
Actionable Tips for Improvement:
- Implement server-side caching: Reduces server processing time and speeds up content delivery.
- Optimize and compress images and other media files: Reduces the size of resources, leading to faster downloads.
- Minify CSS, JavaScript, and HTML: Removes unnecessary characters from code, reducing file sizes.
- Use Content Delivery Networks (CDNs): Distributes content closer to users geographically, minimizing latency.
- Implement lazy loading for below-the-fold content: Loads images and other resources only when they are visible in the user's viewport.
Learn more about Page Load Time and take the necessary steps to optimize your website for a faster, more engaging user experience. This will ultimately contribute to improved search engine rankings, increased conversions, and a stronger online presence.
2. Time to First Byte (TTFB)
Time to First Byte (TTFB) is a crucial website performance indicator that measures the responsiveness of your web server and network. Specifically, it quantifies the time it takes for a user's browser to receive the very first byte of data from the server after initiating a request. Think of it as the time elapsed between clicking a link and the moment your browser starts receiving information. This metric is a key indicator of how quickly your server begins responding and plays a significant role in overall user experience and search engine optimization (SEO).
TTFB encompasses several stages, including:
- DNS lookup: The time taken to translate the domain name (e.g., www.example.com) into an IP address.
- Initial connection: The time required to establish a connection to the server.
- SSL negotiation: If your site uses HTTPS, this includes the time spent establishing a secure connection.
- Server processing time: The time it takes for the server to process the request and generate the first byte of the response.
Typically measured in milliseconds (ms), TTFB focuses primarily on server-side performance rather than front-end optimizations like image compression or JavaScript minification. It provides a valuable glimpse into the backend efficiency of your website.
Why TTFB Matters (and Deserves a Place on This List)
TTFB is important for several reasons:
- Isolating Backend Issues: A high TTFB often pinpoints problems residing on your server or within your network infrastructure, allowing you to differentiate these from front-end performance bottlenecks.
- SEO Impact: Search engines, including Google, consider TTFB as a ranking factor. A faster TTFB contributes to a better user experience, which search engines prioritize.
- User Experience: While not directly visible to users in the same way as page load time, a slow TTFB can lead to a perceived sluggishness and negatively impact user satisfaction.
Pros and Cons of Using TTFB as a Website Performance Indicator:
Pros:
- Helps isolate backend performance issues from frontend ones.
- Good indicator of server and network efficiency.
- Critical for SEO as search engines consider TTFB in rankings.
- Can identify issues with hosting, server configuration, or database queries.
Cons:
- Doesn't reflect the complete page load experience.
- Can be affected by external factors outside your control (e.g., the user's internet service provider or geographic location).
- Improvement may require complex server-side optimizations.
- Not always directly visible to end-users.
Real-World Examples:
- The BBC significantly improved user engagement metrics by reducing their TTFB from 927ms to 69ms through implementing edge caching.
- Shopify recognizes the importance of TTFB and targets a TTFB of under 200ms as a key performance metric for its platform.
- WordPress.com achieved a 30% reduction in average TTFB by migrating to HTTP/2.
Actionable Tips for Improving TTFB:
- Upgrade Server Hardware or Hosting Plan: If your TTFB is consistently slow, consider investing in more powerful server hardware or a better hosting plan.
- Optimize Database Queries: Identify and optimize any slow-running database queries that are executed when a page loads.
- Implement Server-Side Caching: Caching frequently accessed data on the server can dramatically reduce TTFB.
- Use a Content Delivery Network (CDN): A CDN can cache your website's static assets closer to your users, reducing latency and improving TTFB.
- Enable HTTP/2 or HTTP/3: These newer protocols offer significant performance improvements, including faster connection establishment and data transfer.
By monitoring and optimizing TTFB, you can ensure a more responsive and efficient website, leading to a better user experience and improved search engine rankings. This makes TTFB a vital metric for anyone involved in web development, digital marketing, or online business.
3. First Contentful Paint (FCP)
First Contentful Paint (FCP) is a crucial website performance indicator that measures the time from when the page starts loading to when any part of the page's content is rendered on the screen. This doesn't necessarily mean the page is fully loaded or interactive, but it does indicate when the user sees something – anything – other than a blank screen. This is vital because it directly impacts the user's perception of your website's speed and responsiveness. A slow FCP can lead to frustration and a higher bounce rate, while a fast FCP contributes to a positive user experience and encourages engagement. This metric is part of Google's Core Web Vitals, highlighting its importance for overall website performance and search engine optimization.
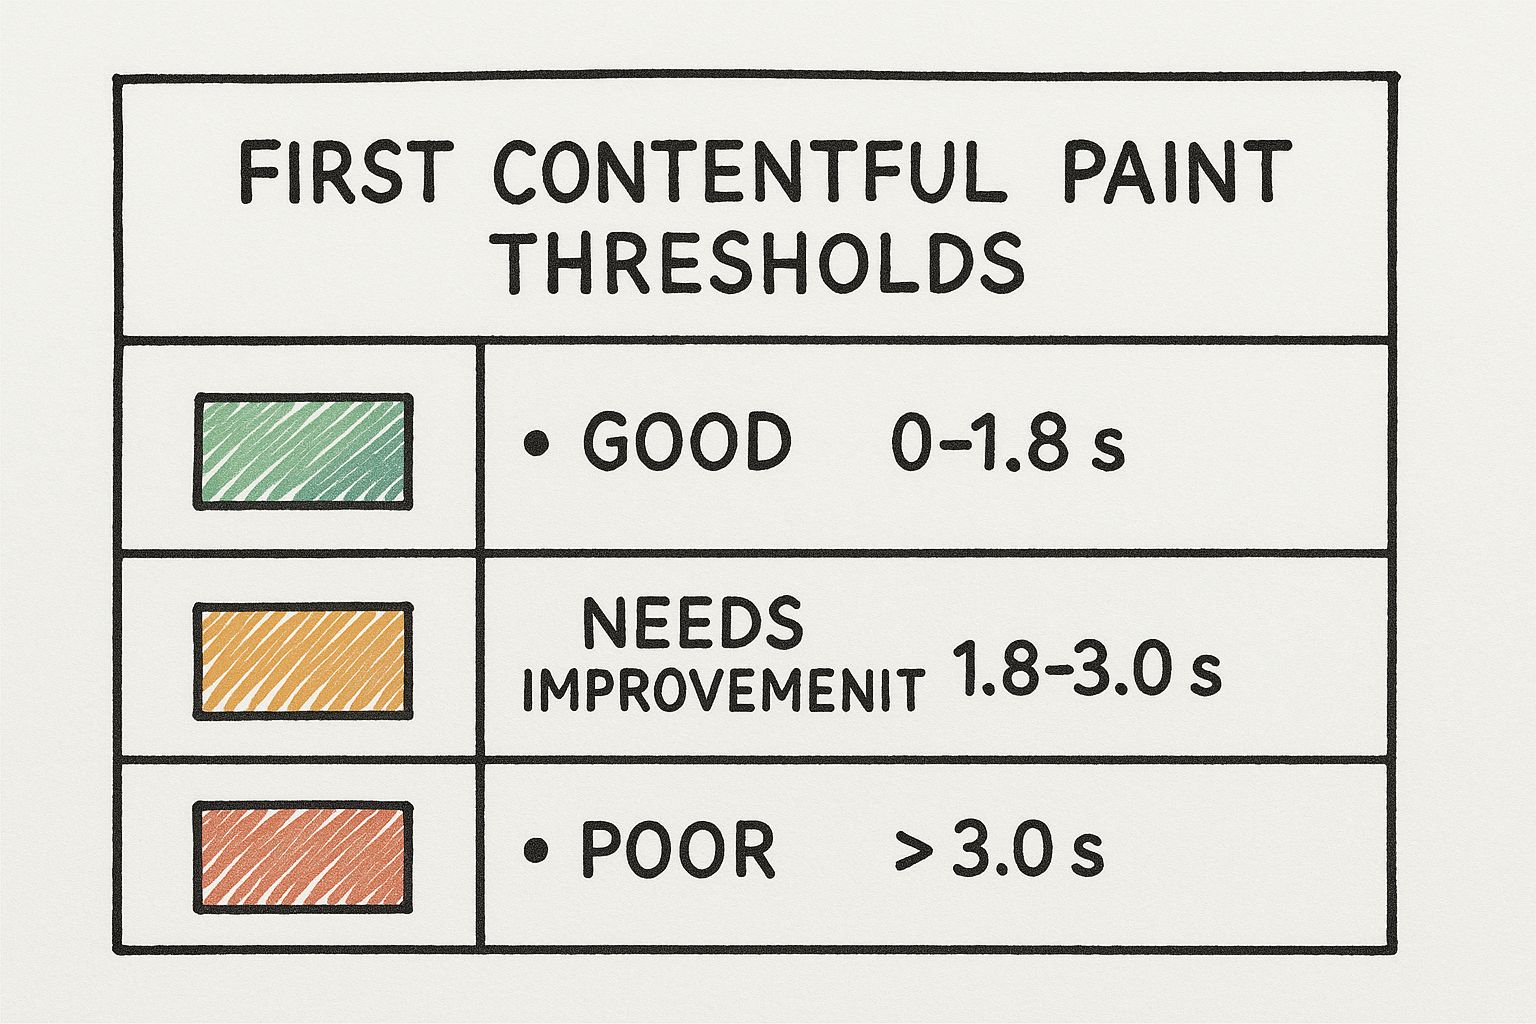
The infographic above provides a quick reference for understanding FCP: it visualizes the core concept of FCP as the time to first pixel painted on the screen after a user initiates a page load. It emphasizes the user-centric nature of this metric and underscores its significance within the broader context of web performance. The good, needs improvement and poor categories provide clear benchmarks for evaluating your FCP score.
FCP specifically measures when the browser renders the first bit of DOM content, which can include text, images (including background images), non-white <canvas> elements, or SVGs. A good FCP score is generally considered to be under 1.8 seconds. This makes FCP a more user-centric metric than more technical metrics like Time to First Byte (TTFB), which measures server responsiveness.
Here's a summary box with key takeaways regarding FCP:
FCP: Key Takeaways
- Definition: Time to first visual content rendered on the screen.
- Importance: Impacts user perception of speed and responsiveness.
- Target: Under 1.8 seconds for a good user experience.
- Impact: Affects bounce rates and user satisfaction.
- Measurement: Part of Google's Core Web Vitals.
Why does FCP deserve its place on this list of website performance indicators? For starters, it offers critical insight into the perceived loading experience. While other metrics might indicate fast server response times, FCP tells you how quickly the user actually sees something happening on the page. This is a powerful indicator of user satisfaction and can directly impact your bounce rates. By optimizing for FCP, you're prioritizing the user's immediate experience.
Pros of using FCP as a performance indicator:
- Provides insight into the perceived loading experience.
- More user-centric than technical metrics like TTFB.
- Helps identify rendering blocks in the critical rendering path.
- Directly impacts user satisfaction and bounce rates.
Cons of using FCP as a performance indicator:
- Doesn't account for the usefulness of the content displayed. A quickly rendered splash screen doesn't necessarily mean the user can do anything yet.
- May show content before the page is actually interactive.
- Can be misleading if the first painted content isn't meaningful to the user.
- Varies significantly based on network conditions and device capabilities.
Examples of Successful FCP Implementation:
- The Financial Times: Redesigned their site with FCP in mind, reducing it by 50% and increasing subscriber engagement.
- Airbnb: Improved their FCP by 36% by implementing code splitting and critical CSS inlining.
- Twitter's Progressive Web App: Achieved FCP within 1 second, contributing to a 65% increase in pages per session.
Actionable Tips for Improving FCP:
- Eliminate render-blocking resources: Defer non-critical CSS and JavaScript files.
- Inline critical CSS: Include the CSS required for above-the-fold content directly in the HTML.
- Implement server-side rendering: For faster initial paint, especially for content-heavy websites.
- Optimize font loading: Utilize
font-display: swapto prevent fonts from blocking page rendering. - Prioritize visible content: Structure your HTML to load the most important content first.
FCP was popularized by the Google Chrome team through their Web Vitals initiative and the Lighthouse performance auditing tool. The Progressive Web App (PWA) movement also emphasizes FCP as a key metric for delivering fast and engaging web experiences. By focusing on FCP, developers and designers can create websites that feel responsive and engaging from the very first moment a user lands on the page.
4. Largest Contentful Paint (LCP)
Largest Contentful Paint (LCP) is a crucial website performance indicator that measures the render time of the largest content element visible within the user's viewport. This essentially means it tracks how long it takes for the main content of a page – be it an image, video, or large block of text – to load and become visible. Understanding and optimizing LCP is paramount for providing a good user experience and achieving strong SEO performance, as it directly reflects how quickly users perceive your site's primary content to be loading.

As a Core Web Vital metric, LCP is directly tied to Google's page ranking algorithm. Unlike earlier metrics that focused on initial load times, LCP hones in on the largest element, which often provides a more accurate representation of when the main content is actually usable. It's important to note that the LCP element can change as the page loads if a larger element appears later in the rendering process. The ideal LCP is 2.5 seconds or less. Anything above that threshold can negatively impact your search rankings and user engagement.
Why LCP Matters for Your Website:
LCP deserves a prominent place on this list of website performance indicators because it offers a user-centric perspective on loading speed. For freelance web designers, digital marketing agencies, startup founders, solo entrepreneurs, and UX/UI specialists, a strong LCP is essential for attracting and retaining clients and users. It contributes directly to a positive user experience, lower bounce rates, and improved conversion rates.
Features and Benefits:
- Core Web Vital: Directly influences Google's search ranking algorithm.
- Focus on Main Content: Measures the visibility of the largest element, providing a better understanding of perceived load time.
- Dynamic Measurement: Adapts as the page loads to identify the largest element at any given time.
- Quantifiable Metric: Measured in seconds, allowing for clear performance tracking and goal setting.
- User-Centric: Closely aligns with how users perceive website speed.
Pros:
- More accurately reflects perceived loading speed compared to older metrics.
- Strong correlation with user satisfaction and engagement.
- Directly impacts SEO rankings.
- Pinpoints specific large elements that may be hindering performance.
Cons:
- Optimizing for both mobile and desktop can be complex.
- Requires finding a balance between visual richness and optimal performance.
- Might not always align with business priorities for specific content types.
- Can be influenced by third-party resources beyond your direct control.
Examples of Successful LCP Optimization:
- Vodafone: Improved LCP by 31%, resulting in an 8% increase in sales.
- Wix: Optimized their platform, boosting LCP by 25% and increasing user engagement across their customer websites.
- The Washington Post: Reduced LCP from 3.5 seconds to 1.7 seconds, improving reader engagement and search ranking.
Actionable Tips for Improving LCP:
- Optimize Images: Use next-gen formats like WebP and ensure proper sizing.
- Preload Resources: Prioritize the LCP element to ensure quick loading.
- Responsive Images: Implement
srcsetfor different screen sizes. - Manage Third-Party Scripts: Remove unnecessary scripts or defer their loading.
- Utilize CDNs: Leverage Content Delivery Networks for faster asset delivery.
- Adaptive Serving: Consider tailoring content delivery based on network conditions.
By focusing on LCP and implementing these optimization strategies, you can significantly improve your website's performance, user experience, and ultimately, your bottom line.
5. Cumulative Layout Shift (CLS)
Cumulative Layout Shift (CLS) is a crucial website performance indicator that measures the visual stability of a page. It quantifies the sum total of all unexpected layout shifts that occur during the entire lifespan of the page load. In simpler terms, it measures how much visible content jumps around as the page loads. This shifting can be incredibly frustrating for users, leading to accidental clicks, difficulty reading, and an overall poor user experience. As a Core Web Vital, CLS directly impacts your website's ranking in Google search results. By focusing on visual stability, CLS helps identify unstable elements that detract from a smooth and enjoyable browsing experience.

CLS is calculated by multiplying the impact fraction (how much of the viewport is affected by the shift) by the distance fraction (how far the elements move). A score of 0 is ideal, indicating no unexpected shifts, while the score can theoretically go to infinity (though very high scores are rare). Importantly, CLS only measures layout shifts not caused by user interaction, focusing solely on unexpected movements of visible page elements. This is key for website performance indicators because user-initiated changes are expected, while unexpected shifts disrupt the user experience.
Why CLS Matters for Your Website
CLS deserves its place among the top website performance indicators because it directly addresses a critical aspect of user experience: visual stability. Unlike metrics that solely focus on loading speed, CLS highlights the importance of a consistent and predictable layout. Improving CLS often leads to:
- Fewer User Errors and Misclicks: A stable layout reduces the chance of users accidentally clicking on the wrong element because something shifted unexpectedly.
- Improved User Engagement: A smoother, more predictable experience encourages users to stay on the page longer and explore more content.
- Better Conversion Rates: A positive user experience contributes to higher conversion rates, as users are more likely to complete desired actions.
- Higher Search Ranking: As a Core Web Vital, a good CLS score contributes to improved search engine rankings.
Pros and Cons of Focusing on CLS:
Pros:
- Directly measures a key aspect of UX that often frustrates users.
- Helps pinpoint the specific elements causing visual instability, simplifying debugging.
- Improvements often translate to tangible benefits like fewer user errors and increased engagement.
- Unlike speed optimizations, CLS improvements can often be achieved without performance trade-offs.
Cons:
- Debugging CLS can be complex without specialized tools.
- Addressing CLS might require redesigning how content loads and renders.
- Certain dynamic content strategies can conflict with maintaining a low CLS score.
- Fixing CLS may necessitate trade-offs with other design priorities.
Real-World Examples:
- The Telegraph: By reserving space for ads, The Telegraph reduced CLS by a remarkable 250%, resulting in a 13% increase in average session duration.
- Vodafone: Identifying late-loading banners as the culprit for high CLS, Vodafone implemented a fix that led to a 15% reduction in homepage abandonment.
- CNET: Redesigning their image loading strategy to minimize layout shifts, CNET improved CLS from 0.25 to 0.1 and reduced bounce rate by 25%.
Actionable Tips for Improving CLS:
- Specify Dimensions: Always include width and height attributes for images, embeds, and ads. This allows the browser to allocate the correct space, preventing shifts when the content loads.
- Reserve Space: Pre-allocate space for dynamic content that loads asynchronously. This can be done using placeholders or skeleton screens.
- CSS Transforms: Use
transformanimations instead of properties liketop,bottom,left, andright, as transforms don't trigger layout recalculations. - Avoid Inserting Content Above: Refrain from inserting new content above existing content unless it's in direct response to user interaction.
- Placeholders and Skeleton Screens: Use placeholders or skeleton screens to visually represent the content that's loading, minimizing the jarring effect of sudden shifts.
Further Information:
By understanding and optimizing for CLS, web designers, marketers, and entrepreneurs can create websites that are not only fast but also visually stable and enjoyable to use. This, in turn, leads to a more positive user experience, improved engagement, and ultimately, a more successful online presence. CLS is a key indicator of website performance that should be considered a priority in today's competitive digital landscape.
6. Bounce Rate: A Key Website Performance Indicator
Bounce rate, a crucial website performance indicator, measures the percentage of visitors who leave your site after viewing only one page without interacting further. Essentially, it reflects how engaging and relevant your content is to your target audience. A high bounce rate often signals a disconnect between user expectations and the content delivered, impacting your site's overall effectiveness. This is why it deserves a place amongst the top website performance indicators. For freelancers, agencies, startups, and UX/UI specialists alike, understanding and optimizing bounce rate is essential for driving conversions and achieving business goals.
How Bounce Rate Works and Its Significance
When a user lands on your website, their browser requests the page from your server. If the user leaves without triggering any further requests – like clicking a link, submitting a form, or adding an item to a cart – it's counted as a bounce. This is expressed as a percentage of total single-page sessions. A high bounce rate might suggest issues with:
- Relevance: The content isn't aligning with user search intent or the promises made by inbound links.
- User Experience (UX): A confusing layout, slow loading times, or poor mobile responsiveness can deter visitors.
- Content-Traffic Match: The traffic source might be driving the wrong audience to your page.
Bounce rate varies considerably depending on industry, page type, and traffic source. For example, a blog post might naturally have a higher bounce rate than a product page. It's important to consider these nuances when analyzing your data. Features such as segmentation by device, traffic source, and landing page provide valuable granular insights. This data is typically measured via analytics platforms like Google Analytics.
Benefits of Monitoring Bounce Rate:
- Content Relevance & User Engagement: Provides a direct indication of how well your content resonates with your audience.
- Easy Communication: The percentage format makes it easy to understand and share with stakeholders.
- Problem Identification: Highlights problematic pages that need optimization in terms of content, design, or technical performance.
- Performance Insights: High bounce rates can be a symptom of slow loading times or other technical issues.
Limitations of Bounce Rate:
- Context is Key: A high bounce rate isn't always bad. Some pages, like contact pages or blog posts, naturally have higher bounce rates.
- Lack of Specificity: Bounce rate doesn't tell you why users are leaving, only that they are.
- Technical Pitfalls: Incorrect analytics implementation can skew the data.
- Engagement Blind Spot: It doesn't account for time spent on page or engagement before bouncing.
Examples of Successful Bounce Rate Reduction:
- Walmart: Improved site load times by 2 seconds, resulting in a 15% bounce rate reduction.
- HubSpot: Found that blogs with relevant internal links reduced bounce rates by 14%.
- Airbnb: Decreased mobile bounce rates by 20% through a redesigned responsive experience.
Actionable Tips to Lower Bounce Rate:
- Speed Up: Improve page loading speed to under 3 seconds.
- Match Expectations: Ensure your content aligns with the promises made by inbound links and ads.
- Clear Calls-to-Action: Guide users with clear and compelling calls-to-action (CTAs).
- Mobile-First Design: Prioritize mobile responsiveness for the growing mobile user base.
- A/B Testing: Experiment with different design and content elements to identify what resonates best with your audience.
- Exit-Intent Popups: Consider using exit-intent popups strategically on high-value pages.
Learn more about Bounce Rate to dive deeper into strategies for improvement. By understanding and optimizing bounce rate, you can significantly enhance user engagement, improve website performance, and ultimately achieve your business objectives.
7. Conversion Rate
Conversion rate is a crucial website performance indicator for anyone concerned with driving tangible business results online. It measures the percentage of website visitors who complete a desired action (a conversion) out of the total number of visitors. These actions could be anything from making a purchase and submitting a contact form to subscribing to a newsletter or downloading a resource. In essence, conversion rate directly connects website performance to business outcomes, demonstrating the effectiveness of your website in achieving its objectives. This makes it a significantly more impactful metric for stakeholders than purely technical performance indicators. For freelance web designers, digital marketing agencies, startup founders, solo entrepreneurs, and UX/UI specialists, understanding and optimizing conversion rate is paramount for demonstrating the value of their work.
Conversion rate is calculated as: (Number of Conversions ÷ Total Visitors) × 100. This can be measured for the entire website or for specific pages and funnels, giving you granular insights into user behavior and the effectiveness of individual elements within your site. It's important to remember that conversion rates vary significantly by industry, traffic source (e.g., organic search, paid advertising, social media), and the specific conversion type.
Features and Benefits:
- Directly Connects Technical Performance to Business Results: Unlike metrics like bounce rate or page load time, conversion rate speaks directly to the bottom line, showing how website performance translates into tangible business gains.
- Quantifiable ROI: By tracking conversion rate, you can quantify the return on investment (ROI) of website improvements, design changes, and marketing campaigns. This makes it easier to justify investments in website optimization.
- Identifies Areas for Optimization: Analyzing conversion rates for different user journeys and funnels can pinpoint areas needing improvement. This allows you to focus your optimization efforts where they'll have the most impact.
- Meaningful to Stakeholders: Conversion rate is a language that resonates with business stakeholders, as it directly reflects business growth and success.
Pros:
- Provides a clear measurement of website effectiveness in achieving business goals.
- Helps quantify the ROI of website improvements.
- Can identify specific user journeys that need optimization.
- Often more meaningful to business stakeholders than technical metrics.
Cons:
- Affected by many factors beyond website performance (e.g., pricing, market conditions, competition).
- Requires proper tracking setup, which can be complex.
- May fluctuate seasonally or with marketing campaigns.
- A single metric doesn't reveal why conversions are occurring or not occurring, necessitating further investigation.
Examples of Successful Implementation:
Several case studies demonstrate the impact of website performance on conversion rates:
- Mobify: Found that for every 100ms decrease in homepage load speed, their conversion rate increased by 1.11%.
- ASOS: Improved site speed by 50% and saw conversion rates rise by 10%.
- AutoAnything: Increased conversion rates by 13% by reducing page load time by 50%.
Actionable Tips for Improving Conversion Rate:
- Implement A/B testing: Experiment with different design elements, content, and calls-to-action to identify what resonates best with your audience and drives the highest conversion rates.
- Create compelling calls-to-action: Use clear, concise, and visually prominent calls-to-action that guide users towards the desired conversion.
- Streamline forms: Reduce form fields to the minimum necessary information to minimize friction and encourage completion.
- Enhance site performance: Every second of delay can impact conversions. Prioritize site speed optimization to create a smooth and engaging user experience.
- Analyze user flow: Identify and remove any obstacles or pain points in the user journey that might be hindering conversions.
- Use social proof: Incorporate elements like customer reviews, testimonials, and trust badges to build credibility and encourage conversions.
- Learn more about Conversion Rate for a deeper dive into optimizing your website for conversions.
Conversion rate deserves its place on this list of website performance indicators because it bridges the gap between technical performance and business success. While other metrics provide insights into how a website functions, conversion rate reveals how effectively it's achieving its core purpose: driving desired user actions and contributing to business growth. By focusing on conversion rate optimization, you can ensure that your website isn't just technically sound but also a powerful engine for achieving your business objectives.
8. First Input Delay (FID)
First Input Delay (FID) is a crucial website performance indicator that measures the time from when a user first interacts with a page (e.g., clicks a button, taps a link) to the time when the browser can actually begin processing that interaction. Unlike metrics that solely focus on loading times, FID quantifies a website's responsiveness – how quickly it reacts to user input. A low FID ensures a smooth and satisfying user experience, while a high FID leads to frustration and potentially lost conversions. As a former Core Web Vital (being replaced by Interaction to Next Paint in March 2024), FID has been a key factor in Google's search ranking algorithm, highlighting its importance for website success. Even after INP takes over, ensuring your site remains responsive to initial interactions is crucial for a positive UX.
Why FID Matters (and why responsiveness still matters after March 2024):
Imagine a user landing on your seemingly fully-loaded website, eager to add an item to their cart. They click the "Add to Cart" button, but nothing happens. The page appears frozen. That's FID in action – the delay between the click and the browser's ability to start processing the action. This delay, even if just a few hundred milliseconds, can be incredibly frustrating and lead to users abandoning their purchase. Even though FID is being replaced as a Core Web Vital, that frustration doesn't disappear, and the user experience principles behind FID still hold true. A responsive website, measured now or in the future by other metrics, is fundamental for user satisfaction and engagement.
Features and Benefits:
- Measured in milliseconds (ms): Provides a precise measurement of the delay.
- Focus on Interactivity: Directly measures the user experience of interactivity.
- Highlights JavaScript Issues: Pinpoints JavaScript execution problems that hinder responsiveness.
- Correlation with User Frustration: A high FID directly relates to a poor user experience.
- Improvement Boosts Engagement: Reducing FID often leads to increased page views, longer session durations, and fewer abandoned sessions.
Pros:
- Real User Experience Focus: Captures the actual user experience rather than theoretical load times.
- Identifies JavaScript Bottlenecks: Helps developers pinpoint and address performance issues.
- Strong User Frustration Correlation: Provides a clear indication of potential usability problems.
Cons:
- First Interaction Only: Doesn't reflect the responsiveness of subsequent interactions.
- Real-User Data Required: Cannot be simulated in lab environments, making continuous monitoring essential.
- Transitioning to INP: Being replaced by Interaction to Next Paint as a Core Web Vital in March 2024.
Examples of Successful Implementation:
- The Weather Company: Improved FID by 79% through code splitting, resulting in a 13% increase in page views.
- Slack: Optimized JavaScript execution, reducing FID from 130ms to 45ms and achieving 25% longer session durations.
- Mercado Libre: Reduced FID by 90% and saw a 76% reduction in abandoned sessions.
Actionable Tips for Improvement:
- Break Down Long Tasks: Split lengthy JavaScript tasks into smaller, asynchronous operations.
- Manage Third-Party Scripts: Remove or defer non-critical third-party scripts that block the main thread.
- Utilize Web Workers: Offload heavy JavaScript computations to web workers, freeing up the main thread.
- Implement Code Splitting: Load only the necessary JavaScript for the initial page view.
- Optimize Event Handlers: Ensure event handlers are lightweight and efficient to minimize processing time.
- Lazy Loading: Implement lazy loading for below-the-fold content and features to reduce initial load.
When and Why to Use This Approach:
Prioritize FID (and continue to prioritize initial responsiveness after the transition to INP) if:
- Interactive Elements are Crucial: Your website relies heavily on user interaction (e.g., e-commerce, web applications).
- High FID is Detected: Monitoring tools reveal a high FID, indicating a negative impact on user experience.
- Improving User Engagement is a Goal: You aim to increase user engagement, conversions, and session durations.
Even though FID will be replaced by INP as a Core Web Vital, understanding and optimizing for First Input Delay remains valuable for ensuring a positive user experience. By focusing on the responsiveness of your website, you can significantly improve user satisfaction, reduce bounce rates, and ultimately drive better business outcomes.
Key Website Performance Metrics Comparison
| Performance Indicator | Implementation Complexity 🔄 | Resource Requirements ⚡ | Expected Outcomes 📊 | Ideal Use Cases 💡 | Key Advantages ⭐ |
|---|---|---|---|---|---|
| Page Load Time | Moderate - requires frontend & backend tuning | Medium - tools and infrastructure | Improved user experience, higher conversions | General website performance & user satisfaction | Directly correlates with UX; comprehensive metric |
| Time to First Byte (TTFB) | Moderate to High - mostly backend/server focused | Low to Medium - server & network focus | Faster server response, better SEO | Diagnosing server/network responsiveness | Isolates backend issues; critical for SEO |
| First Contentful Paint (FCP) | Moderate - frontend optimization needed | Medium - rendering and resource loading | Faster perceived load, reduced bounce | User-centric performance for perceived speed | User-centric; highlights first visible content |
| Largest Contentful Paint (LCP) | Moderate to High - image & resource optimization | Medium to High - asset optimization | Faster main content display, better SEO | Content-heavy pages focused on main visual elements | Strong SEO impact; reflects main content readiness |
| Cumulative Layout Shift (CLS) | Medium - involves layout and design changes | Low to Medium - design & coding effort | Improved visual stability, fewer errors | Sites with dynamic content or ads | Measures visual stability; improves UX stability |
| Bounce Rate | Low - mostly analytics setup | Low - analytics tools | Better content engagement, identifies problem areas | Marketing & UX analysis | Easy to understand; reflects content relevance |
| Conversion Rate | Medium to High - tracking and funnel optimization | Medium - analytics and testing | Increased business outcomes | Business performance tracking & optimization | Connects web performance to business success |
| First Input Delay (FID) | High - complex JS and browser interaction tuning | Medium - frontend JS optimization | Better responsiveness, decreased user frustration | Interactivity-focused pages needing improved UX | Direct measure of interactivity; user experience |
Elevate Your Site's Performance Today
Mastering website performance indicators is no longer a luxury, but a necessity for online success. From core web vitals like First Contentful Paint (FCP) and Largest Contentful Paint (LCP) to user experience metrics like bounce rate and conversion rate, each indicator offers valuable insights into how users interact with your website. By focusing on improving metrics like Time to First Byte (TTFB), Cumulative Layout Shift (CLS), and First Input Delay (FID), you directly influence user satisfaction, search engine rankings, and ultimately, your bottom line. Remember, a slow, clunky website can deter users and severely impact your conversion goals. A comprehensive website performance test is crucial for identifying bottlenecks and areas for improvement. By using a reliable speed test tool, you can gain valuable insights into your site’s performance and take actionable steps to optimize it. As you implement improvements, consistently monitor these website performance indicators to track your progress and ensure a smooth, engaging user experience.
Related resources
Optimizing for these indicators can feel overwhelming, but it doesn’t have to be. Want a fast baseline? Run a site health check with Roast My Web to get a prioritized snapshot of performance, UX, and SEO issues, then iterate from there.


